MYINNO
HOME OF INNOVATIONS
SMART HOME SOLUTIONS

1. CONNECT HARDWARE
Required HARDWARE:
- Wireless-controlled sockets
- 433Mhz transmitter and receiver
- Jumper cable
- Breadboard
Configure your hardware as described (link)


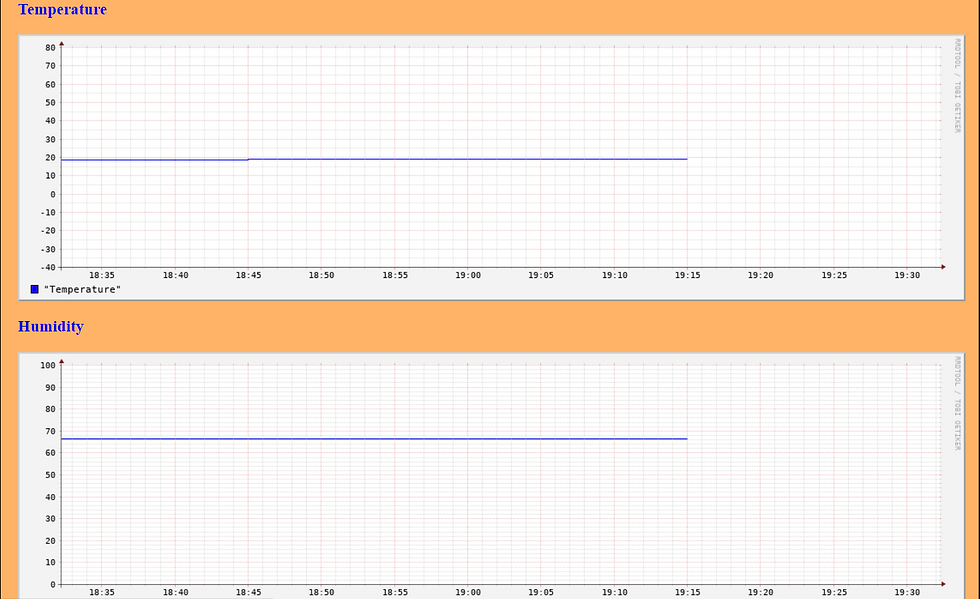
3. CONTROL SOME SENSOR PARAMETERS LIKE TEMPERATURE AND HUMIDITY OVER THE WEBSIDE
Collect sensor data by using round robin data and print them on webside
Connect a BMP180 module to raspberry pi
Install Adafruit: pip3 install Adafruit-BMP
Create a python script called weather
Install rrdtool: pip3 install rrdtool
Create a weather.rrd data
Create some graph for temperature, humidity and pressure every 15 min by a cronjob
USEFUL SCRIPTS
WEATHER.PY
Python Script:
import Adafruit_BMP.BMP085 as BMP085
import os, rrdtool
import time
import Adafruit_DHT
DHT_SENSOR = Adafruit_DHT.DHT22
DHT_PIN = 26
sensor = BMP085.BMP085()
while True:
pressure = sensor.read_pressure()
humidity, temperature = Adafruit_DHT.read_retry(DHT_SENSOR, DHT_PIN)
print ("Pressure = {0:0.2f} hPa".format(pressure/100))
print("Temp={0:0.1f}*C Humidity={1:0.1f}%".format(temperature, humidity))
data = "N:%.2f:%.2f:%.2f" % (pressure/100, temperature, humidity)
rrdtool.update("%s/weather.rrd" % \
(os.path.dirname(os.path.abspath(__file__))), data)
time.sleep(300)
WEATHER.RRD
In command line write:
rrdtool create weather.rrd --step 900 DS:temp:GAUGE:1200:-40:80 DS:psea:GAUGE:1200:900:1200 DS:ploc:GAUGE:1200:900:1200 RRA:AVERAGE:0.5:1:960 RRA:MIN:0.5:96:3600 RRA:MAX:0.5:96:3600 RRA:AVERAGE:0.5:96:3600
CREATEGRAPH.PY
Python Script:
import sys
import rrdtool
if len(sys.argv)<6:
exit
filename = "/var/www/html/tmp/graph_" + sys.argv[1] + ".png"
graphic = rrdtool.graph(filename,
"--end", "now",
"--start", "end-" +sys.argv[5],
"--width", "1024",
"--height", "256",
"--upper-limit", sys.argv[4],
"--lower-limit", sys.argv[3],
"DEF:"+sys.argv[1]+"=/home/pi/Autorun/weather.rrd:"+\
sys.argv[1]+":AVERAGE",
"LINE1:"+sys.argv[1]+"#0000FF:\"" + sys.argv[2] +"\"")